Visual financial planning has moved from a nice-to-have to a genuine competitive edge. Clients no longer respond well to 60-page PDF reports. They want to see their financial life laid out clearly, understand what it means, and feel confident making decisions with their advisor. Two tools that have gained real traction in this space are RightCapital’s Blueprint feature and Asset-Map. Both aim to do the same thing at a surface level: make financial data visual. But they go about it very differently, and those differences matter depending on how you run your practice.
Feature Comparison at a Glance
| Feature | RightCapital Blueprint | Asset-Map |
| Product type | Feature within RightCapital | Standalone platform |
| Visual household overview | Yes | Yes |
| Real-time in-meeting edits | Yes | Yes |
| Net worth visualization | Yes | Yes |
| Goals timeline view | Yes | Via Target-Maps |
| Income, savings & expense visuals | Yes | Yes |
| Risk and gap identification | Limited | Yes, via Signals |
| Relationship mapping | No | Yes |
| Client priorities discovery | No | Yes, via Priorities feature |
| Scenario / draft modelling | Via RightCapital platform | Yes, via Drafts |
| Works with other planning software | No (RightCapital only) | Yes (eMoney, MoneyGuidePro, Orion, etc.) |
| Client portal | Via RightCapital | Yes |
| Pricing model | Included with RightCapital subscription | Separate subscription |
| Best suited for | RightCapital users wanting better visuals | Advisors wanting a dedicated visual engagement layer |
Where Blueprint and Asset-Map Overlap
Both tools solve the same core problem: financial data is complex, and most clients do not process it well when it is presented as numbers in a table or pages of text. Visual layouts create shared understanding faster between financial advisors and their clients. An advisor who can show a client their entire financial picture at a single glance has a significant advantage in building trust and keeping clients engaged.
Both Blueprint and Asset-Map allow advisors to:
- Present household data visually in a client-friendly format
- Use the visual as a starting point for planning conversations
- Show the relationship between assets, liabilities, income, and goals
- Work through updates or changes in the meeting itself
Several advisors who have used Blueprint have described it as a significant step forward, noting that most people are visual thinkers and that being able to show clients a dynamic picture of their financial life changes how the conversation goes. Asset-Map advisors say the same thing. The principle is consistent: visuals create clarity, and clarity builds trust.
Where They Diverge
Here is where the practical differences start to matter.
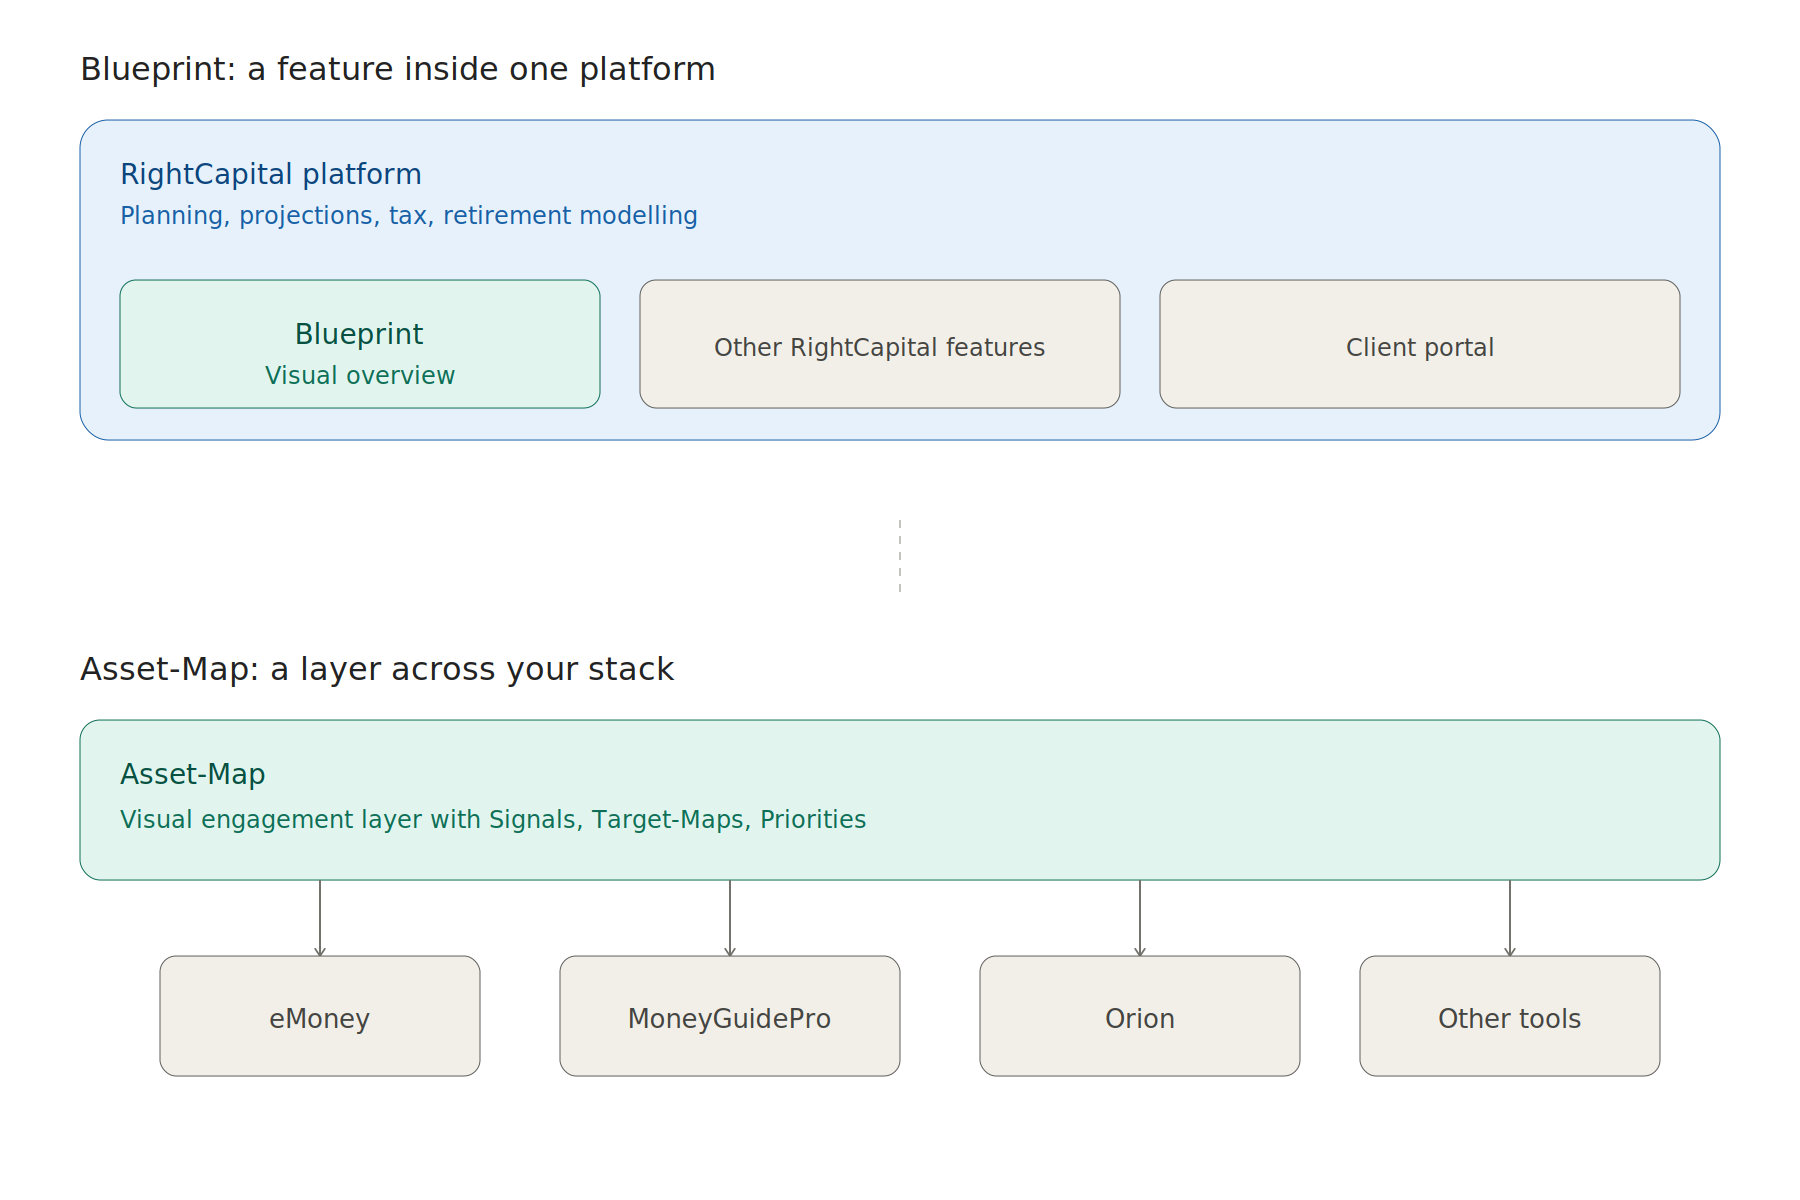
Blueprint is a feature. Asset-Map is a platform.
Blueprint lives inside RightCapital. You cannot use it if you are not a RightCapital subscriber, and it is one part of a much broader financial planning system. If your practice already runs on RightCapital, Blueprint is included and worth using. If you use eMoney, MoneyGuidePro, or another primary planning tool, Blueprint is not available to you at all.
Asset-Map, by contrast, is its own platform. It integrates with your existing tech stack rather than replacing it. Advisors who run eMoney for detailed projections regularly use Asset-Map to present that output in a more visual and accessible way. The two approaches serve different roles in the workflow.
Depth of visual planning capability
RightCapital’s Blueprint covers net worth, goals, income, savings, and expenses. That is meaningful, but it is primarily a data organization and summary tool. The broader RightCapital platform adds depth with retirement projections, Monte Carlo simulations, tax analysis, and scenario modelling, and Blueprint connects into all of that.
Asset-Map is purpose-built for the visual planning conversation. The Signals feature proactively flags risks and gaps in a client’s financial picture, which gives advisors something to act on rather than just display. Target-Maps connect specific goals to timelines and funding realities. The Relationship Mapsfeature lays out who is financially connected and why that matters to the plan. These are designed not just to visualise data but to prompt meaningful action in the meeting.
Client engagement and the advisory conversation
One advisor who uses RightCapital’s Blueprint described using it as a foundation for estate planning conversations, calling it a 10,000-foot view that helps lead clients into deeper discussions. That is exactly the use case Asset-Map was built around from day one. The difference is that Asset-Map gives advisors a full suite of tools specifically designed to structure and guide those conversations, with the Priorities feature helping clients articulate what matters most before the numbers are ever discussed.
Pricing and access
RightCapital is available at $124.95 per advisor per month for the Basic plan and $149.95 per advisor per month for the Premium plan, with Platinum pricing available on request. Blueprint is included at all tiers. That makes it genuinely accessible for any RightCapital user.
Asset-Map has its own pricing structure and offers individual, firm, and enterprise options. Because it is a separate platform, adopting Asset-Map means adding it to your tech stack rather than switching to it outright.
Which Tool Is the Right Fit?
The honest answer is that these two tools are not always direct competitors. The right question is not which one is better overall, but which one fits your situation.
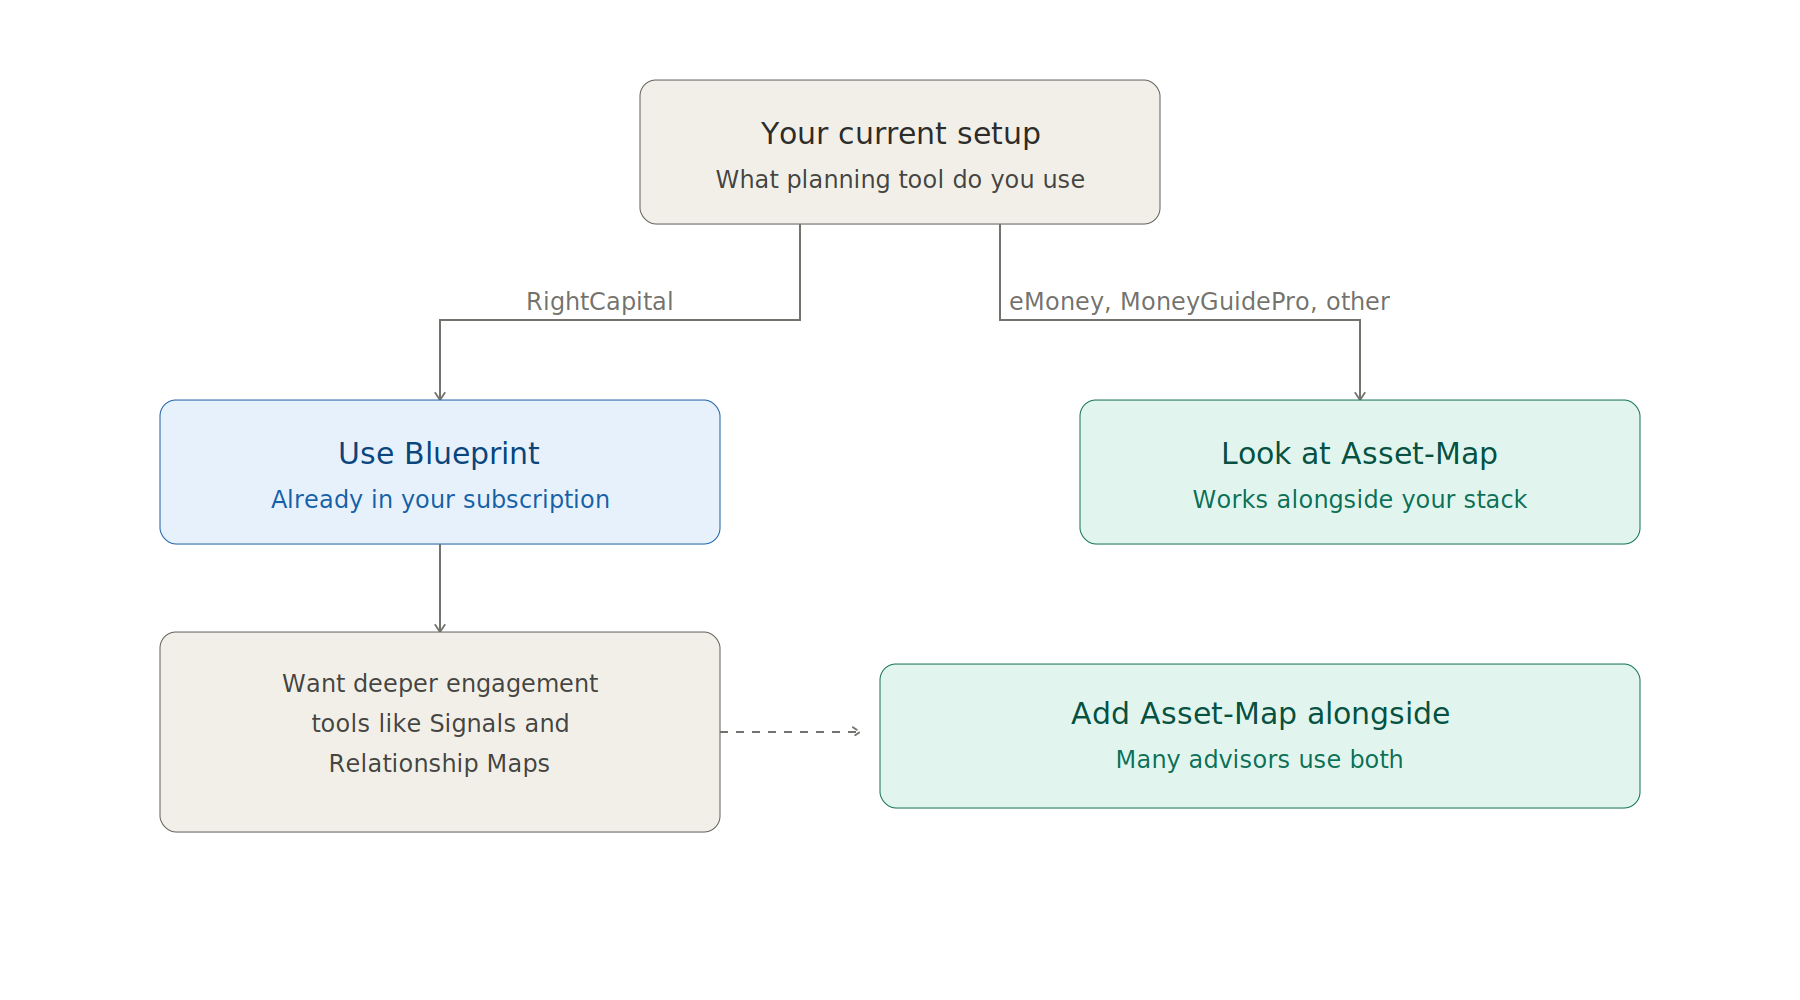
If your practice runs on RightCapital and you are not yet using Blueprint, you should be. It is included in your subscription, and it will change how your client meetings feel. The visual starting point it creates is far more engaging than a data entry screen or a plan summary page.
If you use a different primary planning tool, or if you want a dedicated visual planning layer that works across your entire book of business regardless of what software powers the plan behind it, Asset-Map is worth a serious look. The platform’s focus on engagement, conversation structure, and proactive gap identification goes beyond what a data visualisation feature can offer on its own.
Many advisors who are serious about client-facing presentation use Asset-Map alongside their primary planning platform precisely because the two serve complementary functions. Your planning software does the analysis. Asset-Map makes that analysis something your clients can understand, react to, and own.
If your goal is to run better financial conversations, reduce the time it takes clients to grasp their situation, and turn complex financial data into something that builds confidence rather than confusion, that is the problem Asset-Map was designed to solve.